.png)


In the third part of our blog series, "7 Success Factors for Sustainably Effective Process Orientation," we explore the second success factor: a clear customer and stakeholder focus. Together with Matthias Meinecke (Professor of Operations Management and Board Member at the Institute for Digitalization Aachen, FH Aachen), who has supported numerous companies through various types and scales of reorganization, we have identified and developed this key factor for sustainable process orientation. When operationalizing corporate innovation, the importance of the process map as a powerful communication tool for explaining new or modified business models is often underestimated. Graphically capturing and structuring all processes does more than just provide employees with an overview of which processes are relevant to them; it sharpens the awareness of a clear customer and stakeholder focus.
The third part of our blog series is therefore dedicated to the second success factor for sustainably effective process orientation: "Clear Customer and Stakeholder Focus." This success factor centers on the following questions:
Are external and internal customer focus supported by process maps that effectively visualize business relationships?
Do the depicted processes promote a consistent end-to-end understanding?
In a seven-part series, we will chronologically discuss all seven success factors for sustainably effective process orientation in greater detail.
Overview of previous parts of the blog series: 7 Success Factors for Sustainably Effective Process Orientation:
- Part 1: 7 Success Factors for Practically Effective Process Orientation
- Part 2: 1. Success factor for practically effective process orientation – Defining process management goals and a vision for the future
Excursion: Process Map / Process Landscape
The success factor "clear customer and stakeholder focus" includes, among other things, summarizing all company processes in a process map. In the first step, all overarching processes, such as "acquiring customers" or "further developing products," are consolidated into a process landscape. These overarching processes contain further detailed processes, known as end-to-end processes, which are linked together and represent a company's value chain. The following article shows you what a process landscape can look like graphically: The three most popular process maps from practice
Everyone is talking about innovative business models – but how can they be realized?
Hardly any other topic occupies companies as much as the necessity of digitalization and digital transformation. Companies, government agencies, and associations—everyone is affected and challenged. Everyone with something to say on this topic repeats the mantra of the need to develop new digital business models.

There is a threat of displacement from the market for companies that miss this development. It is just as frequently warned that all processes for existing business models must be digitized to remain competitive. In this context, a structured examination of the terms digitalization and digital transformation has taken place, leading to a differentiation of projects in terms of the degree of innovation and the scope of design. (see figure on the right)
Helpful tools have been (further) developed
The Business Model Canvas and the Value Proposition Canvas are particularly helpful for developing product and service ideas in a structured way. Relevant aspects such as perceived customer value, sales channels, revenue models, and necessary resources are systematically developed and visualized in a clear format. However, this form of modeling is not sufficient for implementing such corporate innovations. A more detailed model of the company—specifically, the enterprise architecture—is required. Against this background, the question arises as to whether the well-known Enterprise Architecture Management can assist in the implementation of corporate innovations and what role business architecture, in particular, plays in this process.
When building an enterprise architecture, the challenge lies in translating the business idea into a process model.
Enterprise Architecture Management refers to the holistic and, above all, integrated management of strategy, processes, IT, and organizational structure—a demanding task, considering that the interplay of even two of these disciplines alone poses a significant challenge for most companies (see figure on the right).

When orchestrating two disciplines, the interface between business architecture and application architecture is often perceived as particularly complex. This is likely due, in part, to the fact that the professional context of the individuals responsible for these two domains differs significantly (business administration vs. IT background). But is the alignment of these domains really the only problem when implementing business models? Looking back at numerous projects involving the strategic realignment of companies or business units (which we also include in the development and introduction of new business models), another challenge was identified, and it lies within a single domain: business architecture.
Depending on the type of innovation, different requirements arise at the various levels of the business architecture, ranging from an individual digitized process and process chains to a business model with a modified process landscape. If you look at examples of the aforementioned Business Model Canvas or Value Proposition Canvas for sketching out business models, they are initially easy to understand and clear. However, they hardly help in driving the operationalization of the business idea. That is not what they are intended for.
The next step, therefore, is to translate the business model into processes. This involves asking which canvas fields require new processes or adjustments to existing processes in order to realize the business operationally. Processes are usually represented in the form of process diagrams according to the BPMN standard. These process representations serve managers as planning, decision-making, and control tools. Executing employees receive information about their tasks and responsibilities as well as the resources and tools to be used from these process representations, while also gaining operational support during execution itself, e.g., through the automation of tasks.
Companies invest large sums in developing and modeling their processes, yet they still find that these processes alone do not help them achieve their stated goals. Incidentally, this does not only apply to companies that want to implement a new business model. They are in good company with long-established businesses that conclude they need to improve their processes to become more efficient, serve their customers faster and more flexibly, or pursue any other goal.
The aforementioned challenge within business architecture arises because the translation of a roughly sketched business model into process diagrams often fails. In our experience, the essential link is a good process landscape. Depending on the scope of the business model adjustment, a changed process structure emerges with a completely new or merely modified process landscape.
What you should keep in mind when graphically representing your process landscape
Many are likely familiar with the typical "text in arrows" diagrams, which is good, as it is important. Through the graphical development of a process landscape across multiple levels—that is, processes that are refined at the next level into sub-processes or partial processes until they are finally represented as process diagrams at the lowest level—an overlap-free, gapless, and complete image of all a company's processes can be created. The process landscape is therefore something like a table of contents, and it primarily serves as such. Many companies also use it to define responsible roles and individuals for processes. A few of these companies understand this responsibility as a leadership task, taking the first step toward becoming a process-oriented organization. But who knows an example of a process landscape that can truly explain a business model? And at a level that allows the relationships between processes—and thus the "logic" of the model—to be described so specifically that decisive characteristics (innovations, differentiation, etc.) become visible and comprehensible.

The sober truth is that maps at the top level of representation are often so highly abstracted that a contract manufacturer in the automotive industry and a plant engineering company can hardly be distinguished from one another. They usually consist of a simulated end-to-end view—with customer requirements as input and generated customer value as output—and a distinction between performance, management, and support processes, which bear such expressionless labels as "develop products" and "sell products" (see figure on the right). The problem with such a process landscape is that it offers no "orientation." It does not help in understanding how the company functions, how it serves its customers, how planning and implementation are connected, how deviations from plans are handled, or whether production plays a role in order processing or not. Consequently, the graphical representation of a process landscape provides no added value beyond its function as a table of contents. The connection between the rough idea of a business model and the executable processes remains unknown.
At this point, the benefit of an end-to-end process understanding—i.e., the cross-departmental, holistic view along the value chain—can only be achieved if all processes are mapped according to fixed principles. An end-to-end process always begins with a specific customer need (e.g., sold solution) and ends with a service (or "intermediate service") for the customer (e.g., implemented solution). The entire value creation process is mapped from market requirements through product development and market development, but also inquiry, customer acquisition, closing, delivery, and customer support along the touchpoints of the customer journey. All processes that a customer goes through, from information about products and services to the decision and usage, are represented. Business-specific, active naming conventions (e.g., "develop software agilely" instead of "product development") make the business model understandable. Clear principles for subdividing the end-to-end process ensure that its complexity is reduced and it becomes operationally controllable. Uniform representation conventions convey an understanding of necessary relationships and responsibilities for processes.
The figure below shows an example of the process landscape of Intellior GmbH. At the top level (Level 1), the process landscape provides an overview of the business model and the processes required for it. These are defined at Level 1 by the controllability of the business through clear goals. In addition, there are process owners for every end-to-end process as well as process managers for every process at Level 2. As a result, there are only weak relationships/interfaces between the processes (=arrows) at the top landscape level, for which a clear definition of the respective inputs and outputs is sufficient. If intensive coordination between multiple processes is typically required for every process run, these should potentially be grouped together and managed by a single process manager.
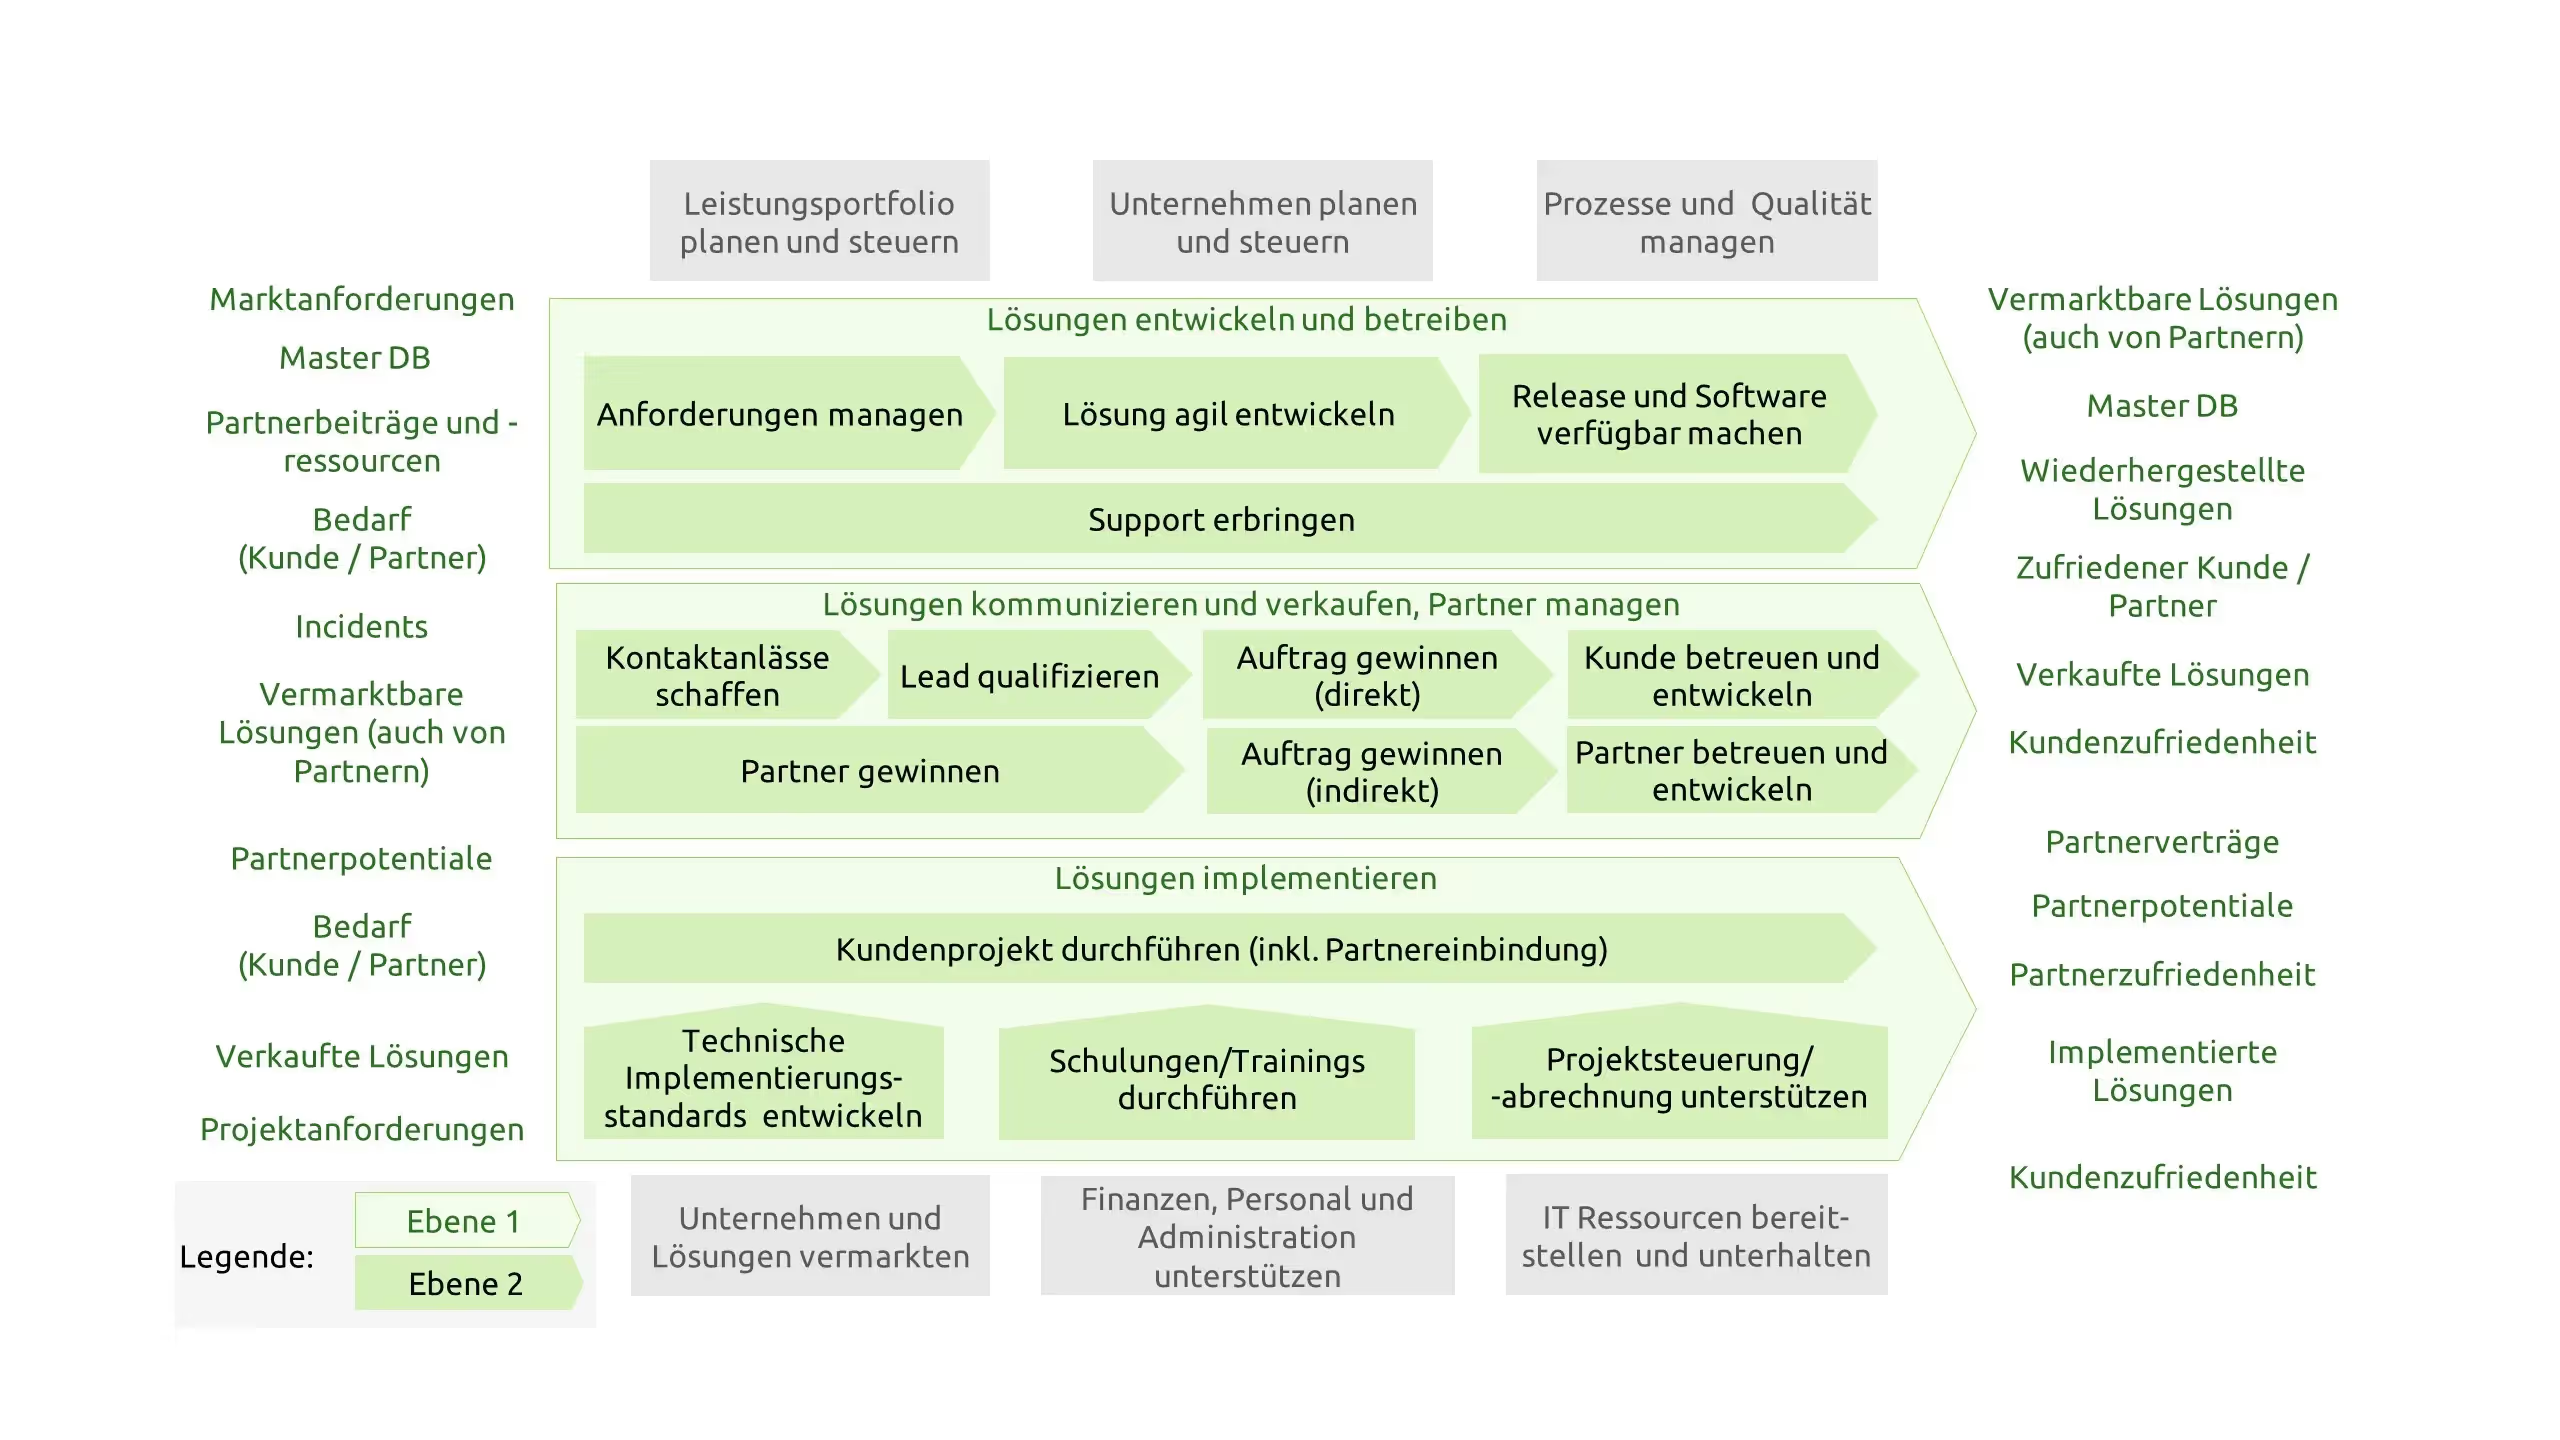
Nevertheless, dependencies almost always arise between the processes at Levels 1 and 2. The process landscape should function as a communication tool for both internal employees and external stakeholders. Checking whether this goal is being met is very useful. Therefore, explain the relationships in the process landscape to different target groups. Explain to your customers how the purchased service is provided, in what timeframe this happens, and what interaction is necessary, while referencing the various processes. Explain to employees in development which processes generate requirements for future solutions and how these are prioritized and transferred into a product roadmap. If the process landscape does not support these "stories," then employees will not see it as a help, and they will pay less attention to the processes represented in the underlying process diagrams.
Structuring the processes within the landscape has another goal, as becomes clear in the example of Intellior AG. Responsibilities for process groups and processes can be derived from it and used as a management tool. In this context, the following questions can be used for structuring/delimiting process landscapes at Levels 1 and 2:
- Where are there necessary temporal decouplings of processes or intermediate processes that do not belong to a continuous process (same output/customer)?
> This requires a division/separation of the processes at the same level (E1 or E2...). - What should ideally be managed and developed "from a single source"?
> This requires a process owner. (L1 or possibly L2) or a process manager (L2 or possibly L3) - Control question: Is the complexity of the operational process manageable? What is the smallest possible breakdown required? Here, the number of executing roles must be considered in relation to process frequency and the degree of standardization.
> One solution for reducing complexity is to divide it into sub-processes at the next level with their own process managers (L2 or L3).
The primary focus is always on achieving manageable process control and clear accountability. Process maps developed in this way meet the requirements of being an "operating model" for the company and help to implement corporate innovations and achieve the desired goals.
In summary, transformation projects should always evaluate which adjustments to the mapped process landscape are necessary, or whether it is even necessary to develop an entirely new map. The process map is not a representation of a functionally oriented organizational structure. Rather, it describes how the company (or a segment of it, such as an independent business unit) functions. It serves as the link between the level of informal or lightly formalized business idea descriptions (see, for example, the Business Model Canvas) and the level of process diagrams, in which workflows, information flows, and resources used are described.
Best practices in our blog posts
For each of the seven success factors, I, along with colleagues from intellior and our partner network, will present "best practices" in a series of follow-up posts. These are supported by intellior's BPM platform, Aeneis, and will help you achieve effective process orientation.
We welcome your comments, discussions, and experiences—feel free to email the authors directly or schedule an expert consultation with our advisors – Schedule an appointment now!