When companies talk about quality management, there is no way around it: the process map. It represents the entire value chain, all management processes and support processes of a company in a structured manner. ISO 9001 does not require a specific form of presentation, but it does require companies to understand, manage and continuously improve their processes.
A well-structured process map fulfills three central tasks:
- Provide orientation: It shows at a glance how the company works.
- Understanding relationships: Responsible people recognize how processes interlock.
- Ensuring quality: the basis for defined, stable and auditable processes.
For process managers, QM managers and ISO 9001 officers, the process map is therefore a central tool and an introduction to any form of process-oriented work.
Why is the process map so central in ISO 9001?
The standard requires that companies “understand and manage their activities as interlinked processes.” In practice, this means:
- Processes must be clearly defined.
- Dependencies must be visible.
- Responsibilities must be clear.
- Risks, opportunities and quality requirements must be comprehensible for each process.
Scientific research also shows that this process-oriented approach is much more than mere compliance with standards. In their study “The Link between Business Process Management and Quality Management” Stravinskiene & Serafinas (2020) demonstrate that effective quality management is hardly possible without a clear, structured understanding of processes. The authors show that BPM acts as a basis for quality management because transparency, standardization and systematic process thinking enable direct quality improvements.
The process map is the starting point for understanding, structuring and managing processes in accordance with ISO 9001. It makes the overall process structure, connections and areas of responsibility visible and thus forms the basis for fully documenting processes, including risks, opportunities and quality requirements.
What belongs in an ISO 9001 process map?
The standard deliberately does not differentiate between categories, but the following structure has proven effective:
1. Management processes: Strategy, risk management, compliance, quality objectives, or management reviews. In Aeneis, these processes can be linked to ISO 9001 standard chapters.
2. Core processes/value creation processes: All processes that create direct customer benefits, from offer to production and delivery. In Aeneis, they are precisely modeled using BPMN diagrams or in tabular form with SmartModel.
3. Support processes: HR, IT, purchasing, document management, security or data protection. The Aeneis apps (e.g. ISMS, ICS/Risk Management or Audit Management) fit seamlessly here and intelligently link supporting information together.
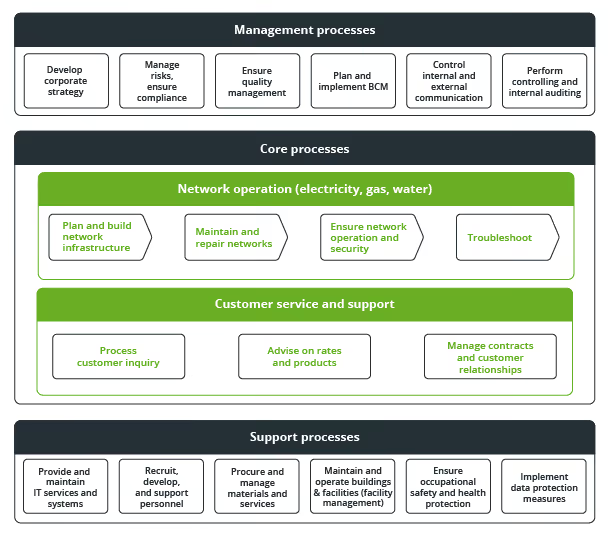
This structure makes organizations controllable and shows where the mission-critical processes are located: those processes that decisively determine the success of the company.
--> More about creating process maps
The process map as a living system
Now that the fundamental role of the process map has been clarified, many companies are faced with the question of how they can efficiently create and maintain such a process landscape and use it in everyday work. This is exactly where the difference between static representations, such as in PowerPoint or Visio, and a professional process management platform becomes apparent.
In practice, process managers, QM officers and ISMS managers need a solution that:
- consistently depicts process structures,
- ensures that everything is up to date,
- clearly manages responsibilities and scopes,
- and links the process map directly to the detailed processes.
The process management software Aeneis meets these requirements and makes it possible not only to model process maps, but also to use them as a living part of the management system. Instead of maintaining a static graphic, the process map in Aeneis is linked to all relevant detailed information and can therefore be used to navigate to the linked objects.
Aeneis enables companies to:
- model processes centrally and in accordance with standards,
- automatically generate structured process maps (column charts)
- intelligently link processes, risks, controls and documents,
- make mission-critical processes visible and
- establish a living management system that is used in everyday life.
--> More about creating a process map in Aeneis
Automatic process maps in Aeneis
In Aeneis, in addition to manually modeled process maps, it is also possible to use process maps generated automatically from the process hierarchy, so-called column charts.

The presentation is:
- clearly structured
- immediately navigable
- always up to date
- audit-proof
- multilingual
- versionable
This eliminates the need to manually maintain graphics or stand-alone solutions.
From the process map directly into the process
If a user clicks on a process on the map, the process opens in a detailed view, including a diagram, responsibilities, risks, controls, links to standard chapters (e.g. ISO 9001, ISO 27001), and relevant documents. The process map is therefore not just a graphic, but a navigation tool for the entire management system.

Keep mission-critical processes in focus
Mission-critical processes are those processes that determine the success of a company, such as audit management, IT security, product development, or core regulatory processes.
Aeneis supports exactly these processes by ensuring that:
- every employee knows exactly what to do,
- it is clear who is responsible,
- risks and controls are visible,
- ideas for improvement are recorded and followed up,
- weak points identified in audits are not lost,
- measures are tracked cleanly.
This makes the process map a real security tool for quality, ISMS, BCM, ICS and compliance managers.
Benefits of a process map in Aeneis for ISO 9001 organizations
1. Compliance with standards reliably met: Clearly defined processes, responsibilities, risks, and evidence.
2. Audit preparation at the push of a button: With reports, versioning, scopes and print reports.
3. All processes in one place: No searching in SharePoint, PDFs, or individual files.
4. Continuous improvement integrated: CIP, initiatives, measures, everything linked to processes.
5. Mission-critical processes at a glance: Clear view of risks, weak points and areas for improvement.
The process map is the heart of quality management — and Aeneis brings it to life
A process map in accordance with ISO 9001 is much more than just a nice poster. It is the central control instrument for quality, safety and efficiency. But it can only be fully effective if it is created digitally, intelligently linked and used in everyday working life.
Aeneis makes this possible with automatic process maps, clear responsibilities, integrated risks and a living management system that reliably controls mission-critical processes.
Try Aeneis now for free and experience how easy professional process management can be.

FAQs
Does every organization have to have a process map in accordance with ISO 9001?
Yes. The standard requires a description of the processes and their interactions. The process map is the most common and accepted means of doing this. With Aeneis, you can create this process map not only in compliance with standards, but also fully integrated into your management system.
How does a process map differ from an organizational chart?
A process map shows the process organization, i.e. how value creation and support processes work together. An organizational chart shows the organizational structure, i.e. responsibilities, roles and departments.
In Aeneis, both representations complement each other perfectly:
- The process map automatically displays processes and process groups.
- The organizational charts are also generated automatically and contain organizational units, roles and responsibilities.
By linking both views, you can see who is responsible for which process — essential for mission-critical processes — at the push of a button.
Can process maps be automatically updated in Aeneis?
Yes. Changes to processes automatically affect the column charts that represent the process map.
How does Aeneis support ISO 9001 compliance?
Through the integrated IMS, standard chapters, links, uniform structure, automatic reports and approval workflows.
Can I export process maps from Aeneis?
Yes, all organizational charts and diagrams can be exported as PNG, JPEG, SVG, or PDF, for example.